Tableau or Bust: Evaluating Proprietary and Open Source Data Visualization Tools for Social Sector Needs
I published an article over the weekend with the MERL Center and GitHub Social Impact! The topic is on data visualization and open source, and the many nuances practitioners face when making software decisions in the social impact space.
The link to the article is here. Below is a hot take on the core message and why I set out to write the article.
TL;DR: Data Visualization in The Social Sector
The quality of proprietary business intelligence (BI) software like Tableau and PowerBI seems to far outweigh available open source (OS) BI tools, which often push clients to use Tableau or PowerBI. Is it really Tableau or Bust? Are there no comparable OS tools? Or is there scope for OS tools to provide a level of quality that is effective for use in the MERL tech space?
In my article, I examine the gap to provide insight into how existing OS BI tools may be used, their use cases, and the development needed to reach the level of quality of proprietary tools.
But what makes choosing a data visualization tool so different in the social sector?
There’s a multitude of factors that differentiate the social sector and other sectors. One major concern is the organization’s budget and time resources to purchase licenses or train staff. For example, a practitioner may ask:
Can I afford to purchase enough proprietary software licenses for my team?
Can I afford the training required for this software?
My team has the knowledge to build a customized OS solution. However, will the end user of my dashboard be able to run the script and interpret the results?
Other concerns may include the tool’s ability to handle different and complex data types, reproducibility, or even how often the tool is updated. For example:
If I choose the free and “public” version of Tableau, will it be displayed online in a public folder. Will I run into any privacy issues when building a dashboard or must I purchase a license to make my visualizations private?
Can I share my code, data, and analysis with stakeholders?
There are dozens of tradeoffs that the practitioner should be aware, which can be distilled into four key themes (1) software costs; (2) privacy and governance issues that are specific to the context and field; (3) the existing support and software community, albeit OS or proprietary; and similarly (4) the organization’s technical readiness that can support long-term maintenance.
Read more to find out alternatives to Tableau and even use cases within the MERL context!
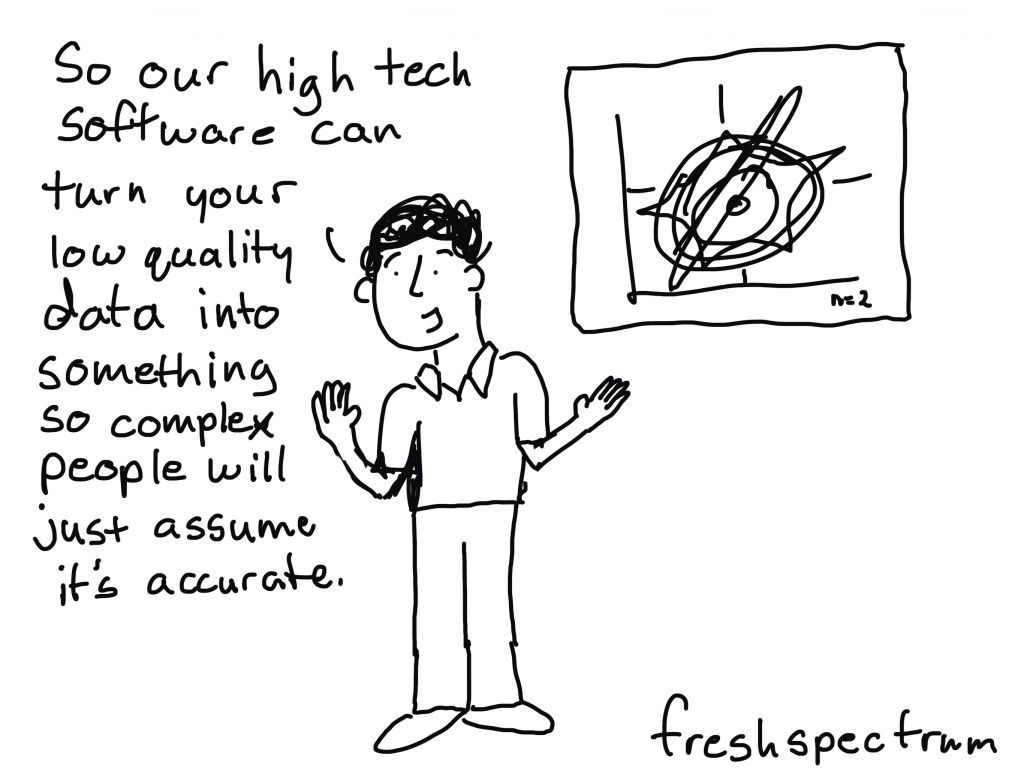
Image from freshspectrum.com


